NZD/JPY price analysis: Bullish bias prevails as bears run out of steam
- The NZD/JPY is currently trading at 91.63, registering gains of 0.32% in Wednesday's session.
- The daily chart analysis reveals consistent bullish sentiment, with RSI and MACD affirming positive momentum.
- Hourly indicators also show a dominant bullish bias.
In Wednesday's session, the NZD/JPY was spotted at 91.63, reflecting a 0.32% gain as bears seem to run out of steam after two sessions of losses..
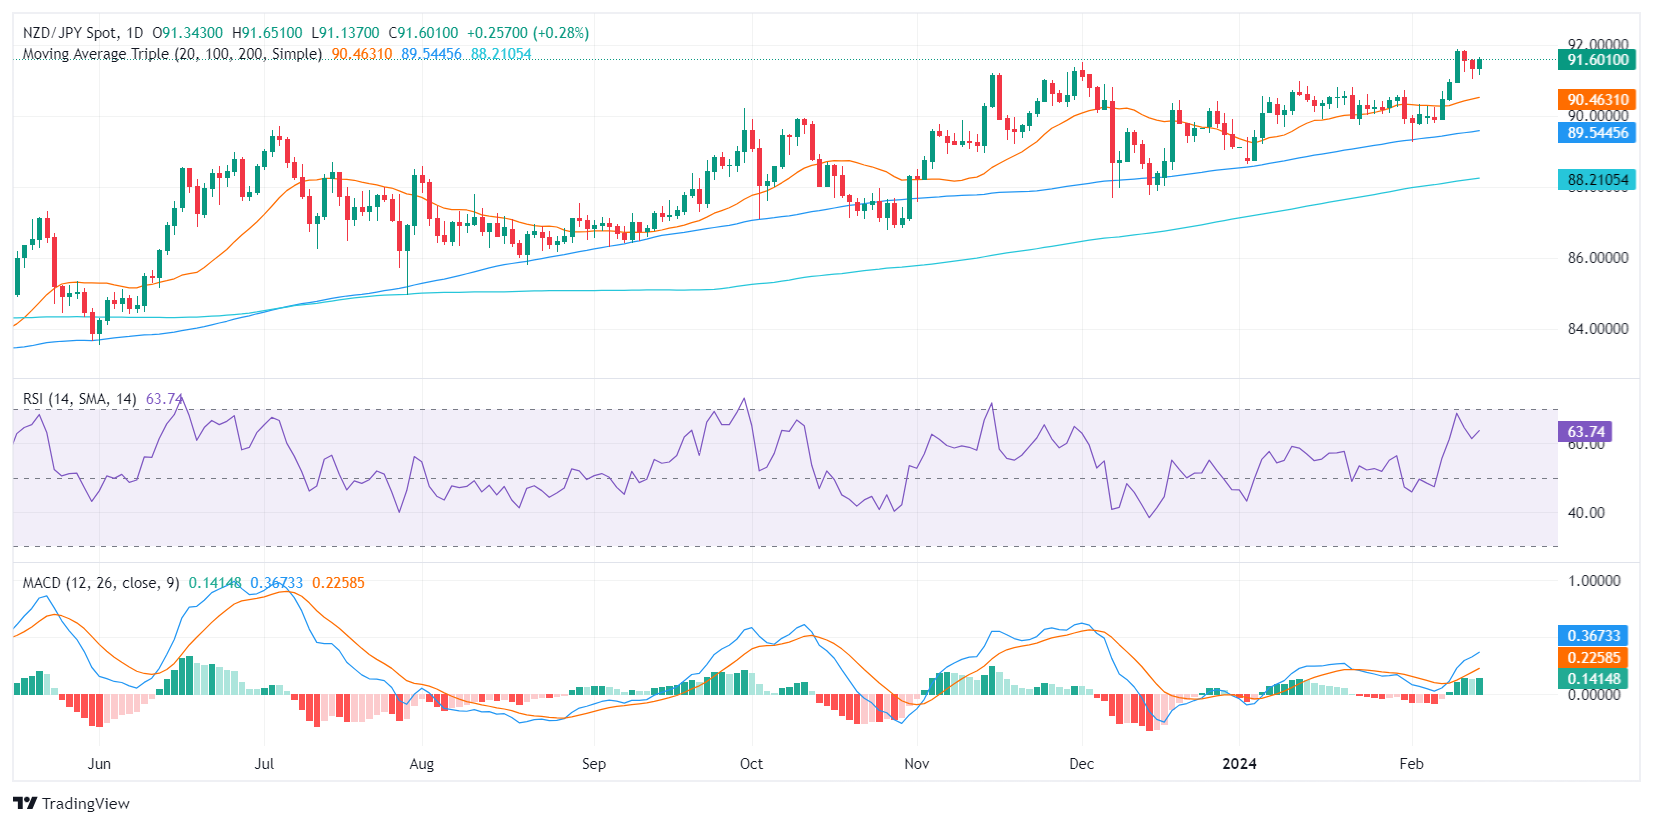
Beginning with the daily chart analysis, the Relative Strength Index (RSI) suggests sustained positive sentiment as it consistently lies within the upbeat territory, without stepping into the overbought space. Simultaneously, the MACD histogram prints green bars and shows a rising trend, reinforcing the positive momentum depicted by the RSI. Moreover, the cross maintains its position above the 20,100,200-day Simple Moving Averages (SMAs), signaling continued control by the bulls in large time frames.
NZD/JPY daily chart
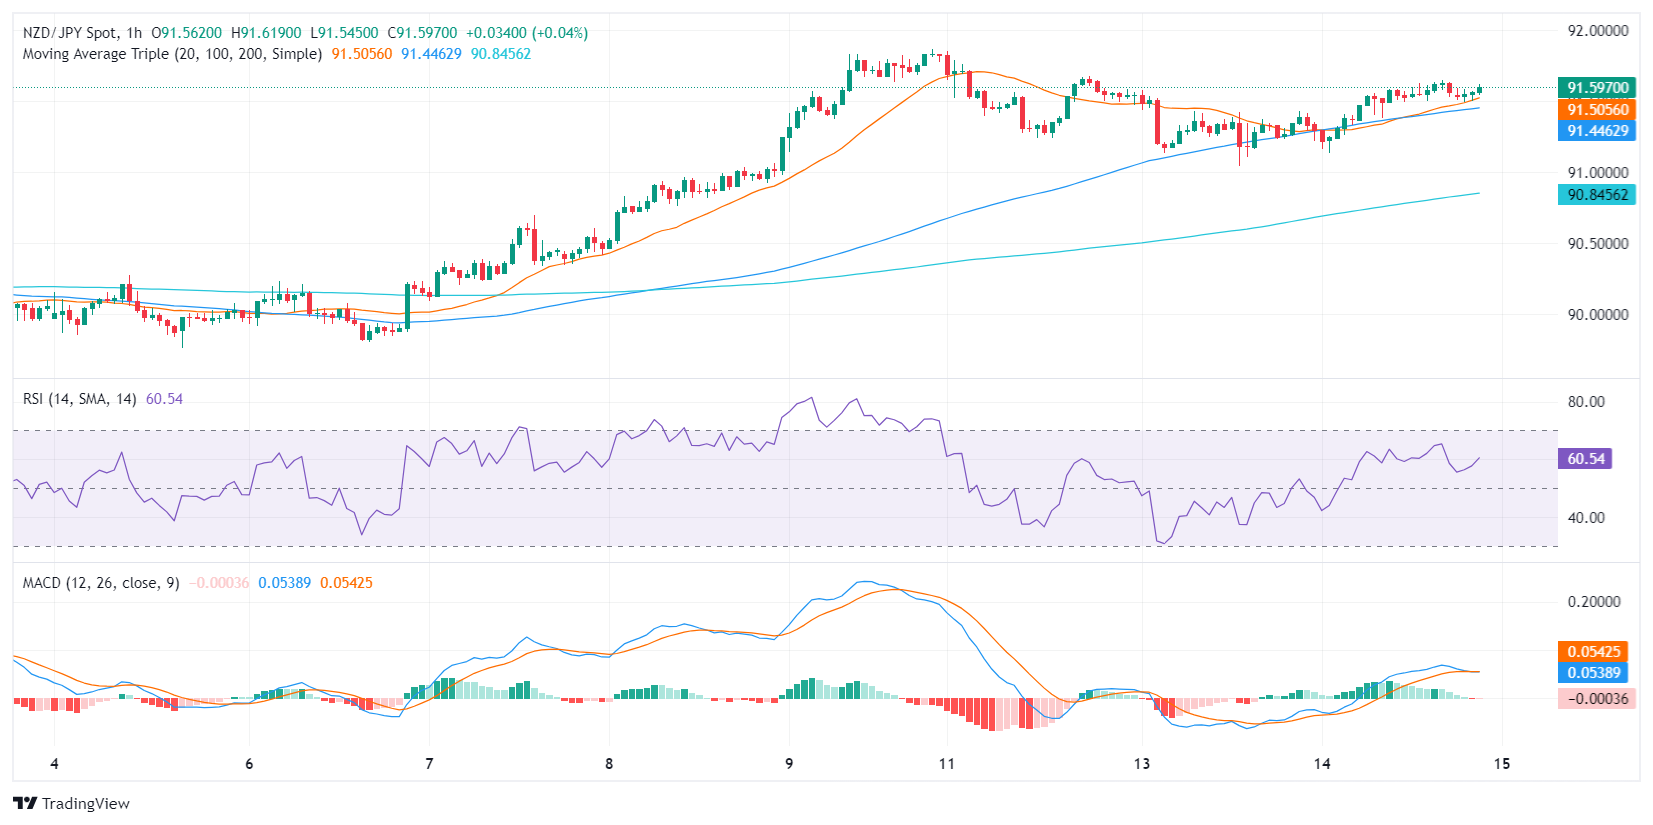
Shifting towards the hourly analysis, the RSI readings fluctuate around the positive zone, while the MACD histogram continues printing green bars but seems to be flattening and falling into the negative domain. This aligns with the picture painted by the daily indicators, further solidifying the perception of a dominant bullish bias but the MACD leaves the door open for further downside.
NZD/JPY hourly chart