US Dollar Index recovery stalled near 95.40
- The index remains on the defensive in the 95.40/30 band.
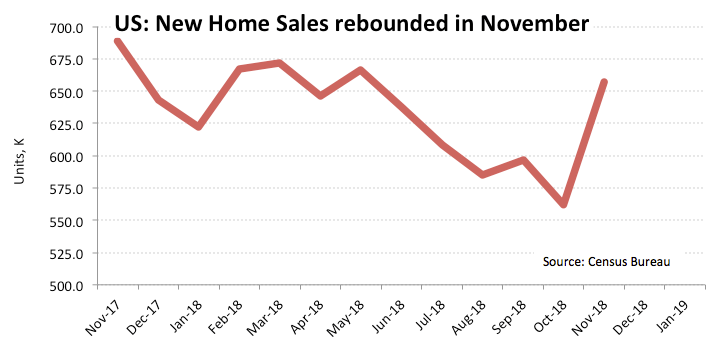
- New Home Sales surprised to the upside in November.
- Trump-Xi Jinping could meet next month in China.
Tracked by the US Dollar Index (DXY), the greenback remains under pressure albeit managing to rebound somehow from daily lows around 95.15.
US Dollar Index supported near 95.20
The index keeps the tight range well in place so far today while market participants continue to digest the recent FOMC gathering, where a more flexible, neutral and data-dependent Federal Reserve appears to have emerged from.
In the US data sphere, inflation figures tracked by Core PCE and Personal Income/Spending readings were postponed. Instead, Initial Claims rose noticeably to 253K WoW reflecting the impact of the government shutdown, while the Employment Cost Index (ECI) rose 0.7% QoQ in the September-December period, missing consensus. On the brighter side, New Home Sales expanded to 657K units (or 16.9%) in November surpassing estimates and October’s 562K.
What to look for around USD
The picture around the greenback has deteriorated further following yesterday’s FOMC meeting. It is thus expected that the index will now remain under extra pressure in the months to come amidst a renewed neutral stance by the Fed, while the Committee did not give any hints on the potential timing for the end of the balance sheet run-off, although it is seen ending sooner than market are forecasting. On the key trade front, President Trump and China’s Xi Jinping could meet next month in China.
US Dollar Index relevant levels
At the moment, the pair is losing 0.08% at 95.32 and a breakdown of 95.16 (low Jan.31) would aim for 95.03 (2019 low Jan.10) and then 94.79 (monthly low Oct.16 2018). On the other hand, immediate resistance emerges at 95.90 (21-day SMA) seconded by 96.13 (100-day SMA) and finally 96.22 (38.2% Fibo of the September-December up move).