AUD/JPY technical analysis: Portrays symmetrical triangle below 200-HMA
- Upper-line of the short-term symmetrical triangle and 200-HMA can keep exerting downside pressure on the AUD/JPY pair.
- Break of 73.92 can recall 2016 low on the bears’ radar.
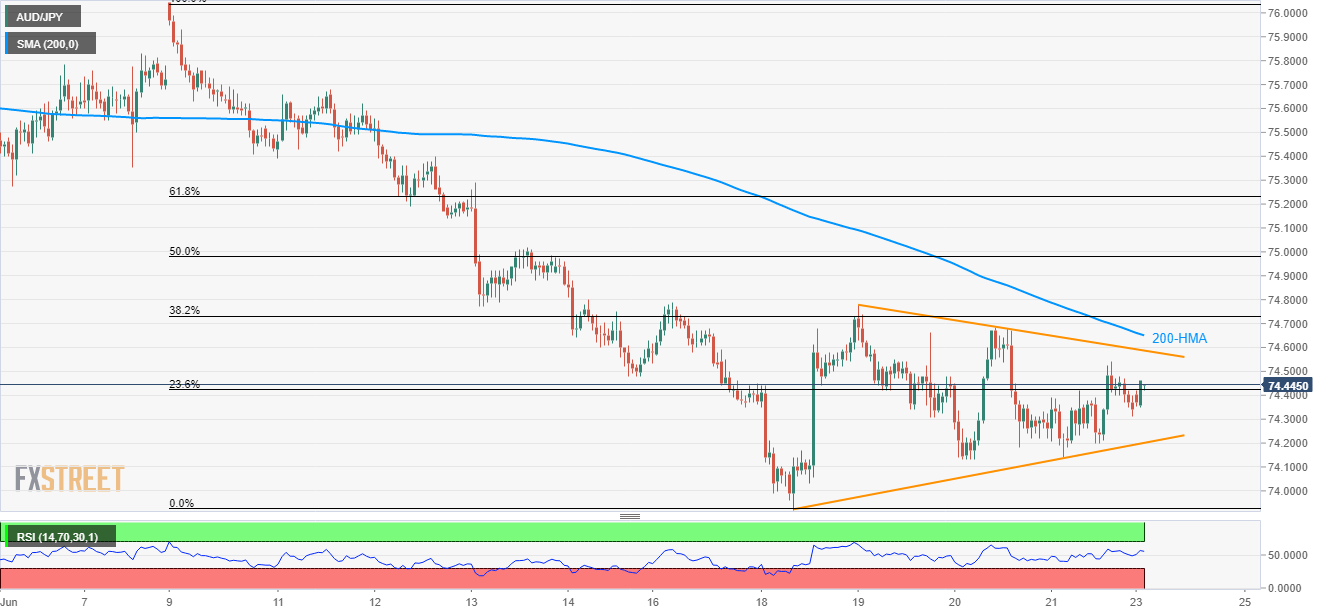
Gradual recoveries from 74.20 help the AUD/JPY pair to take the bids near 74.45 during early Monday. However, short-term symmetrical triangle and 200-HMA can confine the pair’s immediate moves.
While the technical pattern’s resistance near 74.60 acts as the closest upside barrier, 200-hour moving average (HMA) around 74.66 may challenge the pair’s advances post-breakout.
In a case where the quote rallies beyond 74.66, June 17 high at 74.80 and the top of June 13 near 75.00 could become buyers’ favorites.
On the contrary, the downside break of formation support, near 74.20, opens the door for a fresh decline towards the month’s low near 73.92.
Additionally, pair’s extended south-run below 73.92 might not refrain from pleasing bears with 2016 bottom surrounding 72.40.
AUD/JPY hourly chart
Trend: Sideways