Back
29 Oct 2019
EUR/USD technical analysis: Euro rolling into the Asian session near the 1.1100 level
- This Monday, the Fiber consolidated last week’s losses.
- There is a strong resistance at the 1.1109 level.
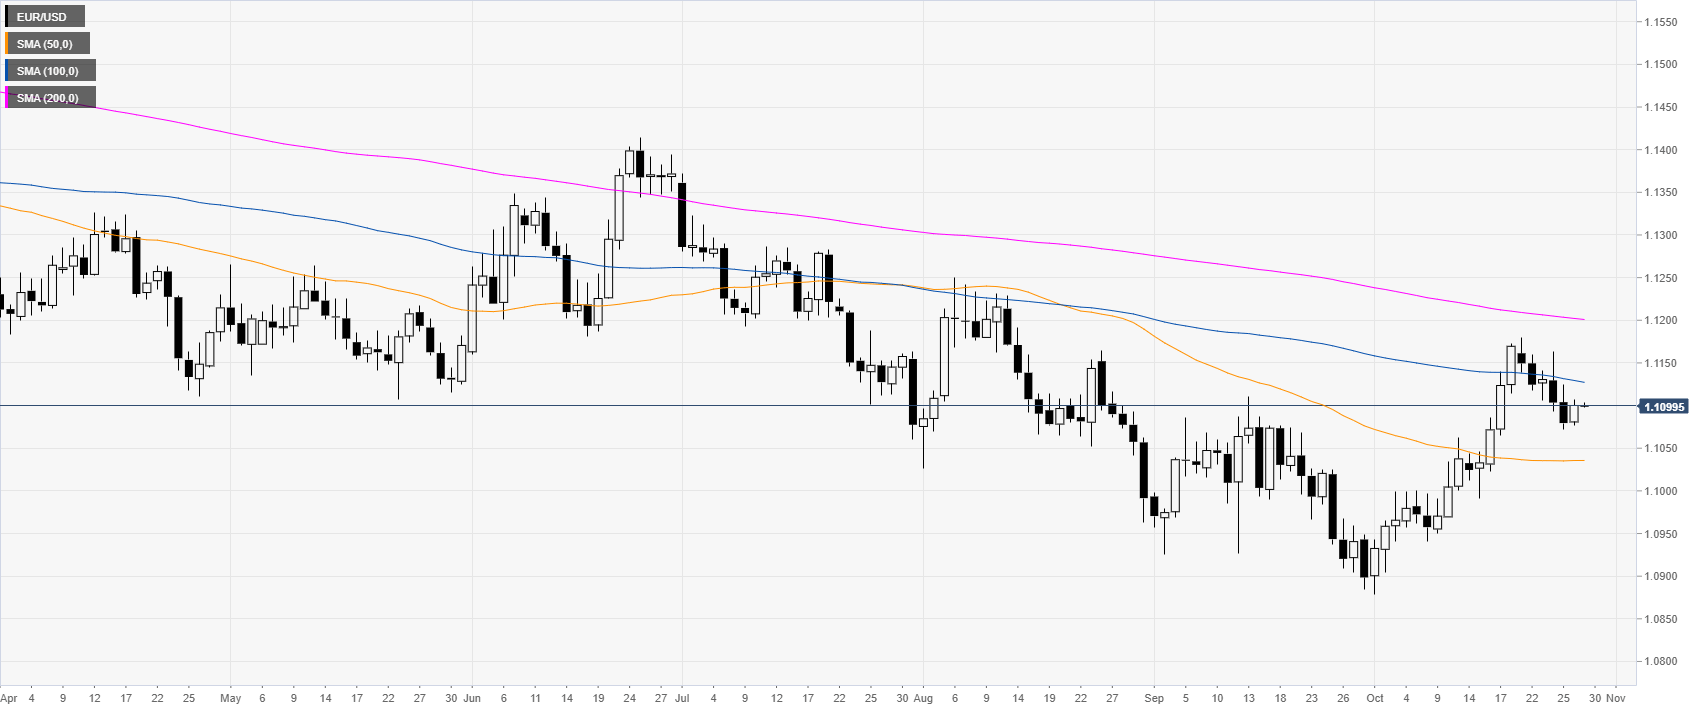
EUR/USD daily chart
On the daily chart, the Fiber is trading in a downtrend below the 100 and 200-day simple moving averages (DMAs). The main macroeconomic event of the week is the Fed Interest Rate Decision on Wednesday.
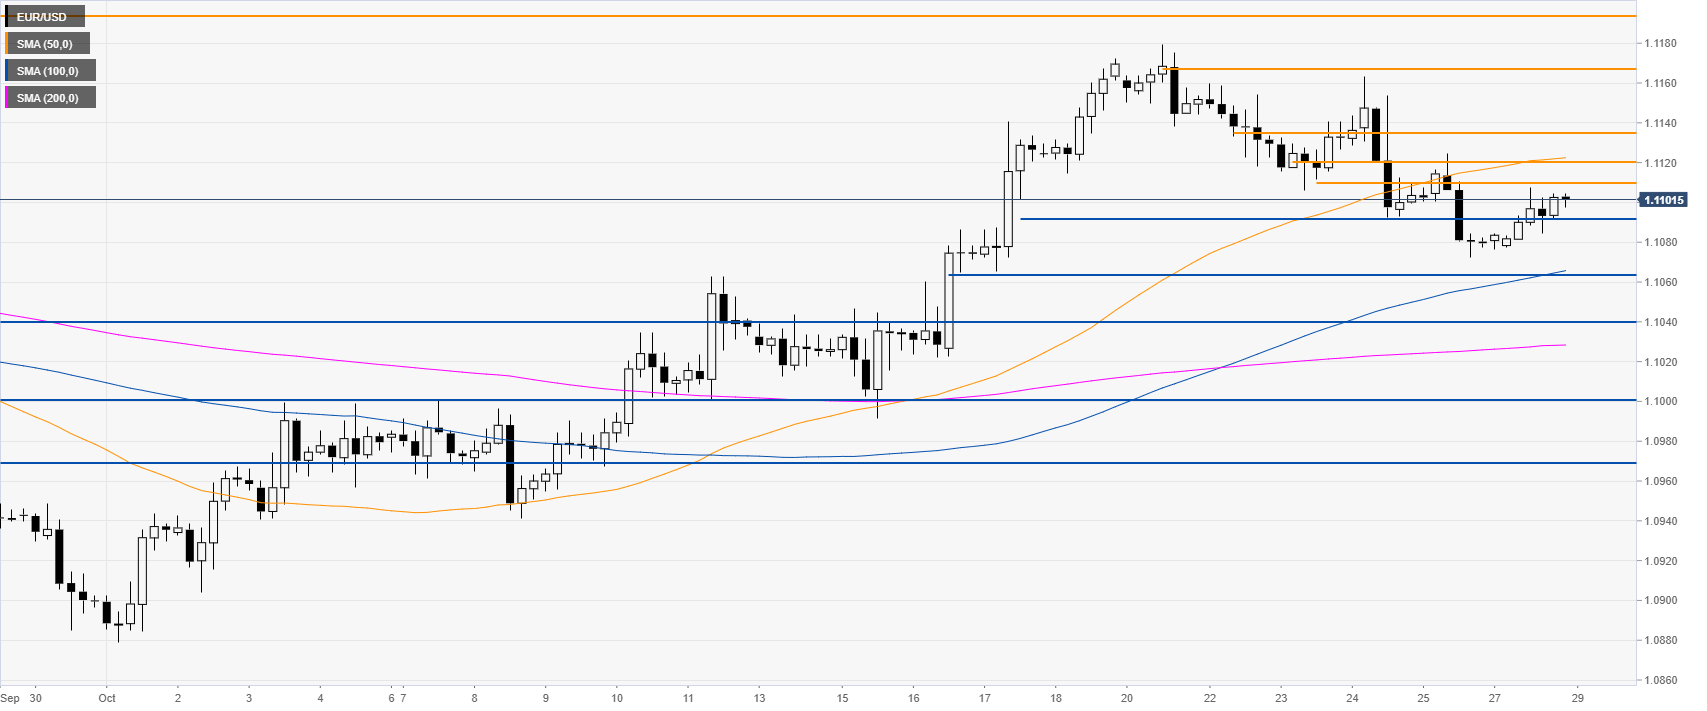
EUR/USD four-hour chart
The Fiber, on the four-hour chart, is trading above the 100 and 200 SMAs. However, the spot is retracing down from multi-week highs, trading below the 50 SMA. The level to beat for bears remains the 1.1065/1.1040 support zone, according to the Technical Confluences Indicator. A break below this area can send the Euro down to near the 1.1000/1.0970 support zone.
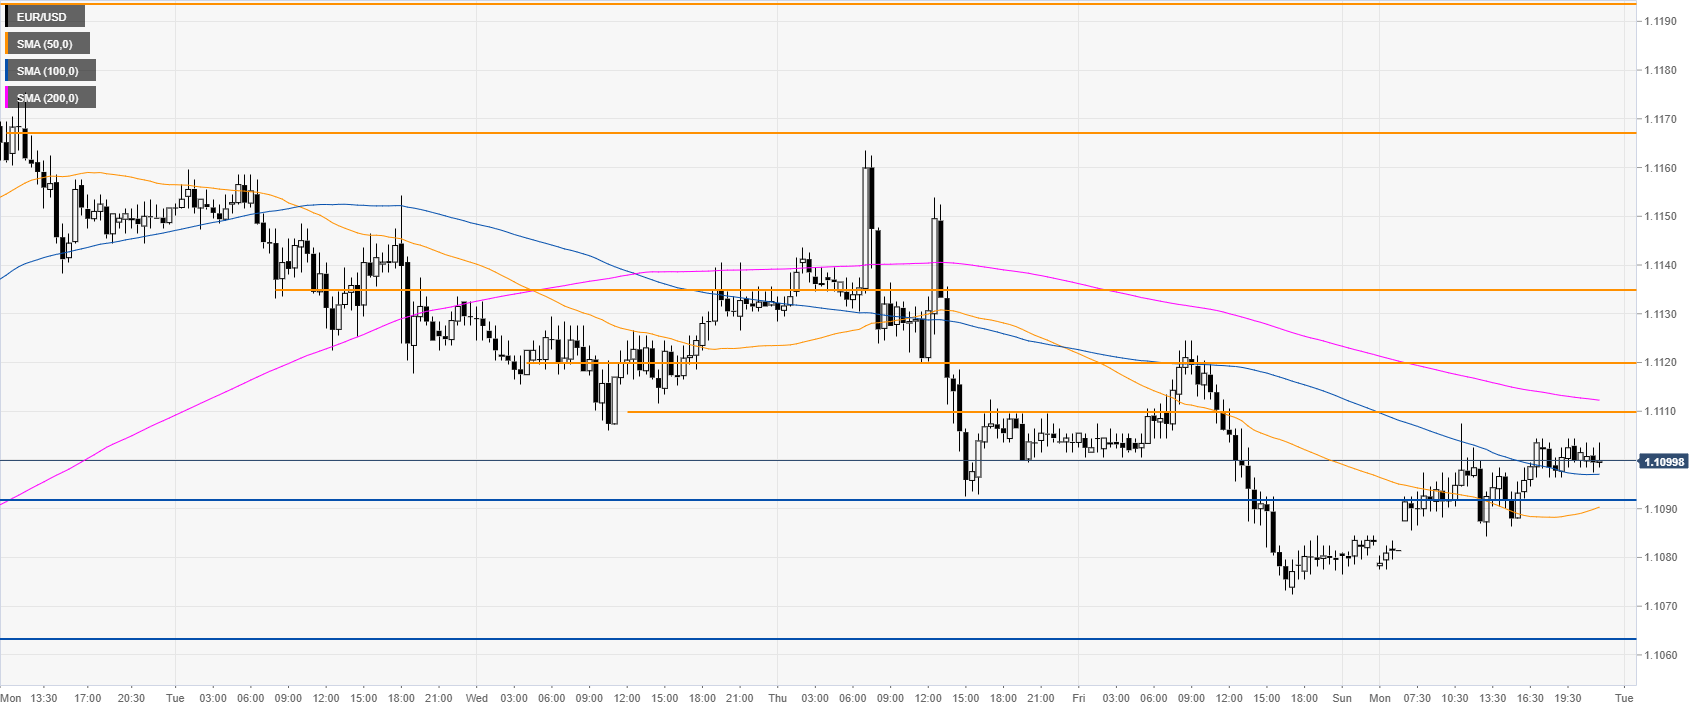
EUR/USD 30-minute chart
The exchange rate is trading between its 100 and 200 SMAs on the 30-minute chart, suggesting a consolidation in the near term. Strong resistance can be seen at the 1.1109 level. Further up, if the 1.1120 resistance gets broken to the upside, then 1.1135 and 1.1167 are the next relevant resistances on the bulls’radar, according to the Technical Confluences iidIndicator.
Additional key levels