Back
9 Dec 2019
GBP/USD price analysis: Cable hanging near seven-month highs below 1.3180 key resistance
- GBP/USD bulls remain in control above the 1.3075 level.
- The level to beat for bulls is the 1.3180 resistance.
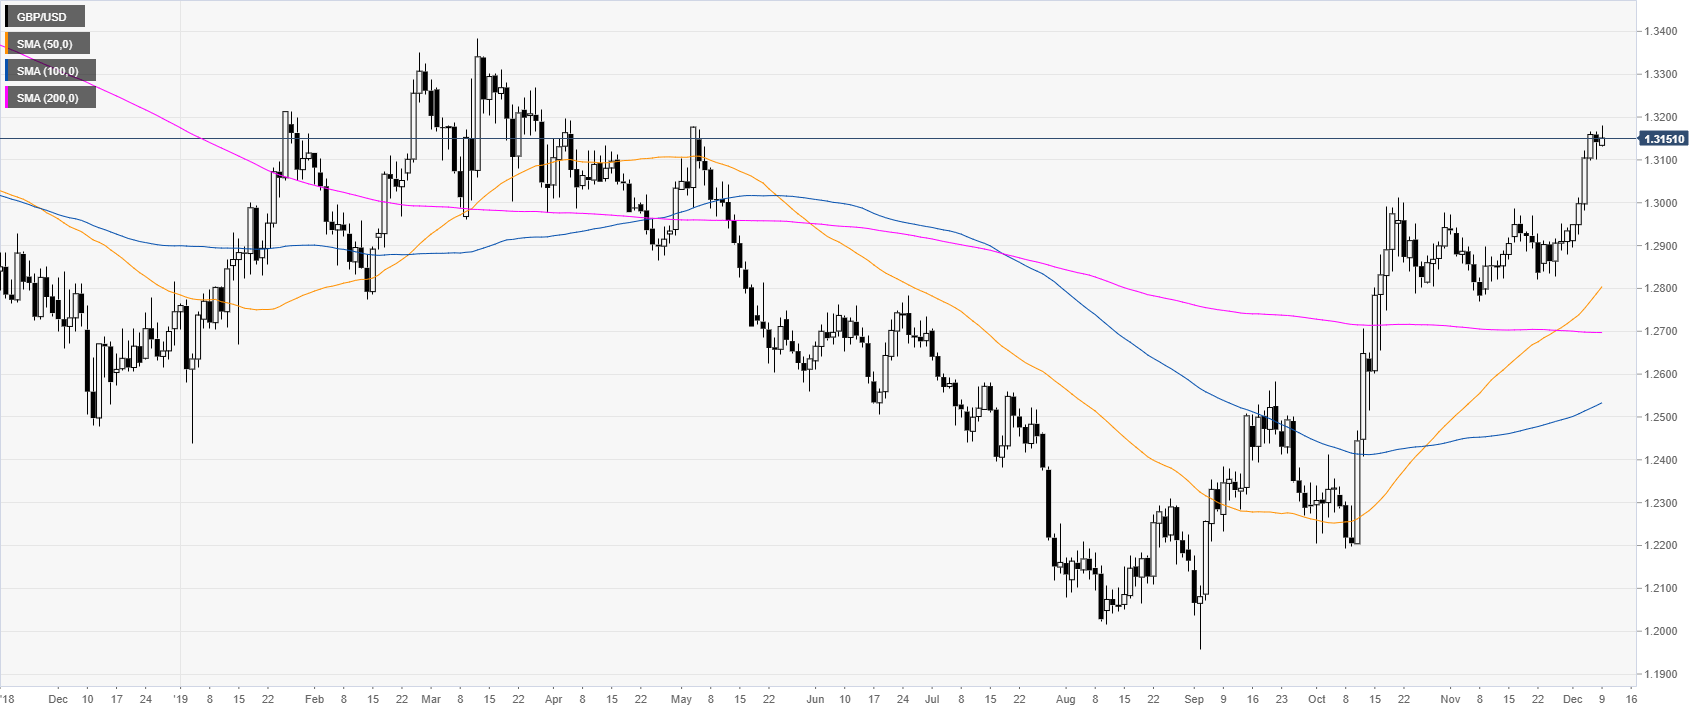
GBP/USD daily chart
The market is hanging near seven-month highs, flirting with levels last seen in early May 2019. In the New York session, the market is trading flat just above the 1.3150 level.
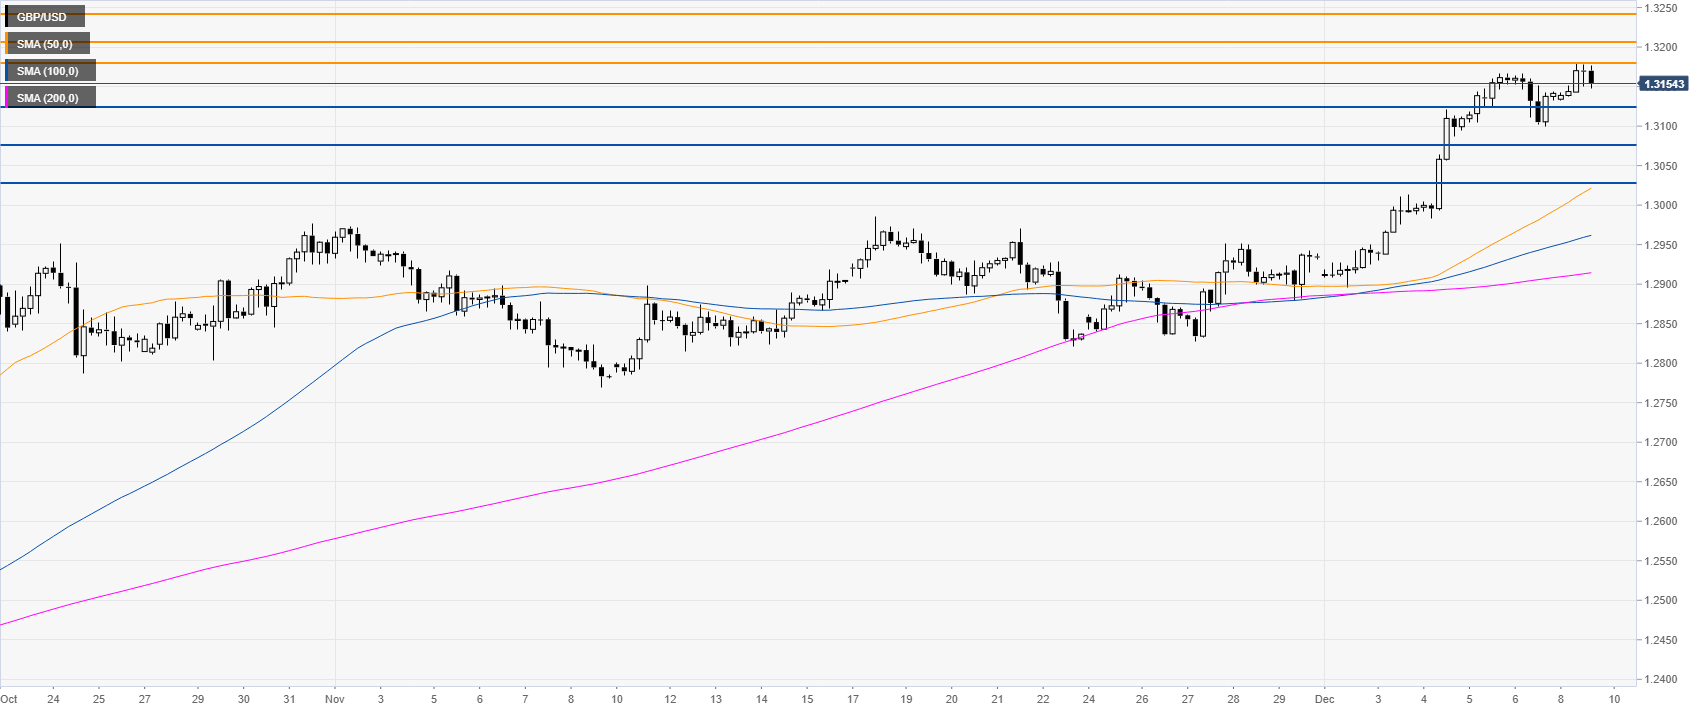
GBP/USD four-hour chart
GBP/USD is trending up above its main SMAs. Bulls need to push through the 1.3180 resistance to open the doors to further gains towards the 1.3207 and 1.3242 resistances, according to the Technical Confluences Indicator.
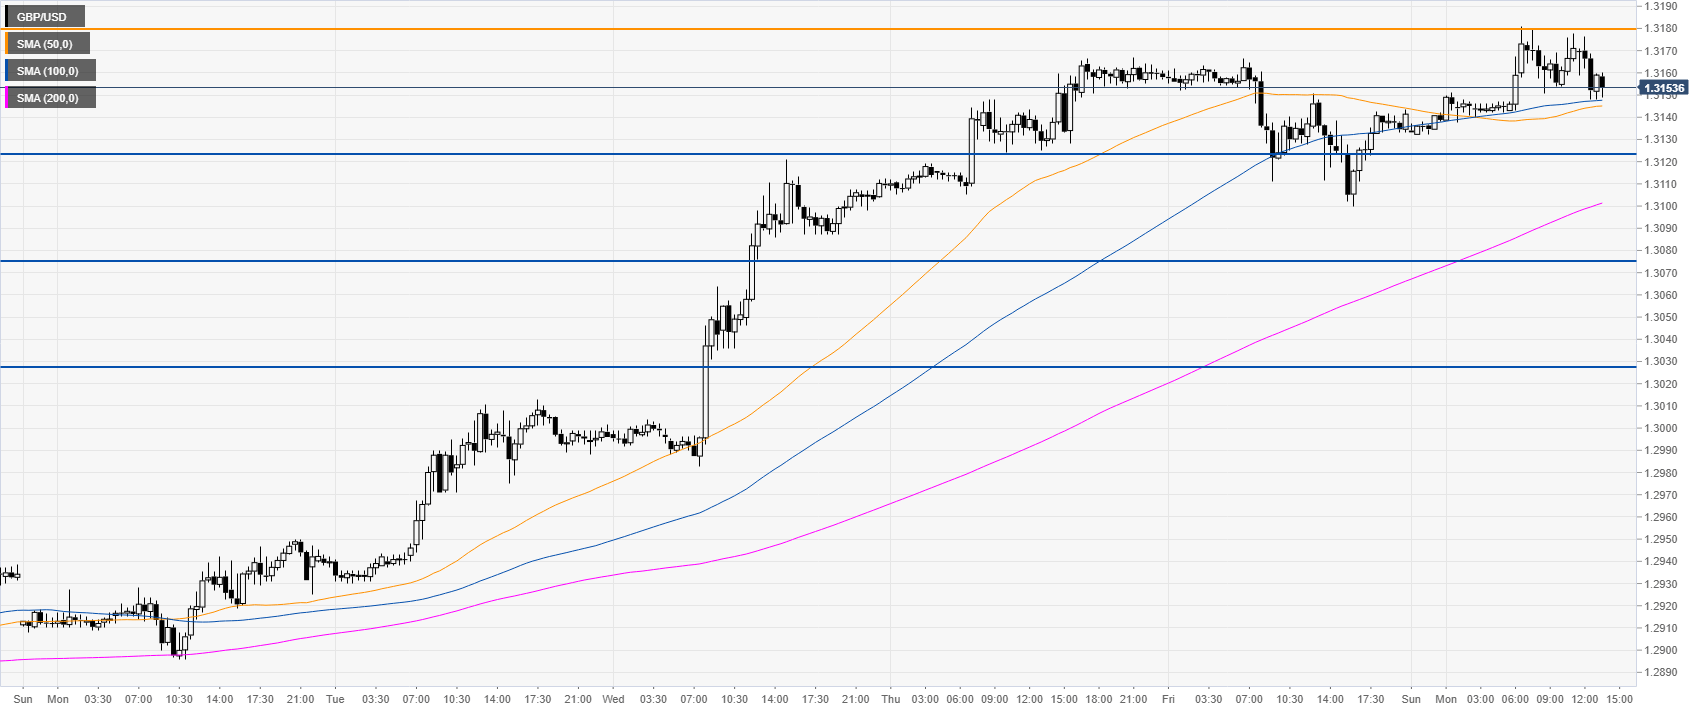
GBP/USD 30-minute chart
After several attempts to break above 1.3180 this Monday, GBP/USD remains virtually unchanged on the day. The spot is evolving above the main SMAs, confirming the bullish bias in the short term. Support is seen at the 1.3125 level. However, a daily close below the 1.3075 level can lead to a deeper retracement towards the 1.3029 level.
Additional key levels