Back


19 Dec 2019
Gold Price Analysis: XAU/USD attempts to break above $1480/oz
- Gold remains sidelined in December 2019.
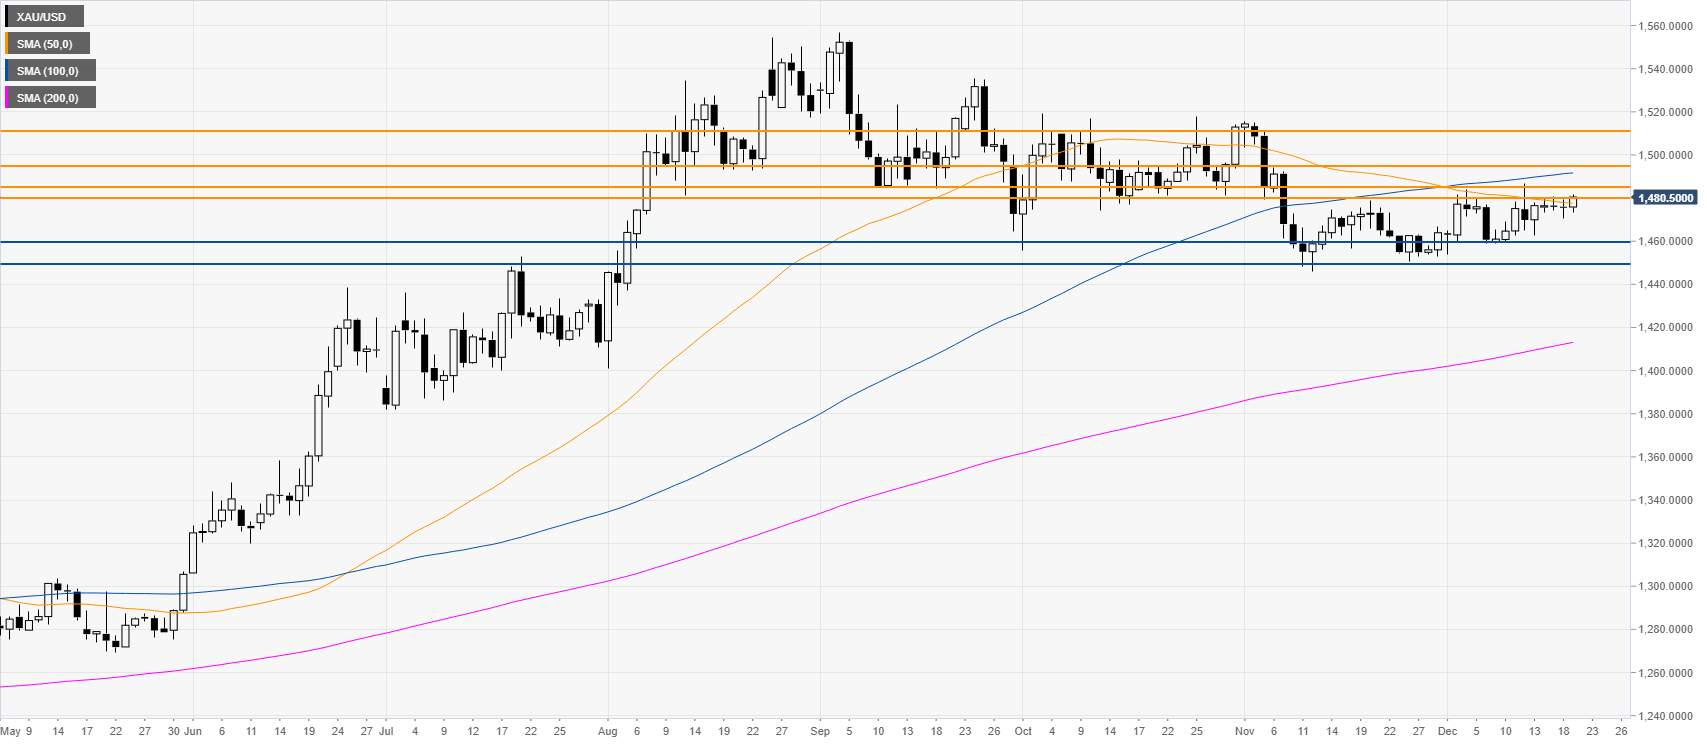
- The level to beat for buyers is the 1480/85 resistance zone.
- On the way down, support can be located at the 1460/50 price zone.
Gold daily chart
XAU/USD remains trapped in an unusual small range for the fourth consecutive day. However, this Tuesday after the London close, the bulls are attempting to break above the 1480 resistance and the 50-day simple moving averages (DMAs).

Gold four-hour chart
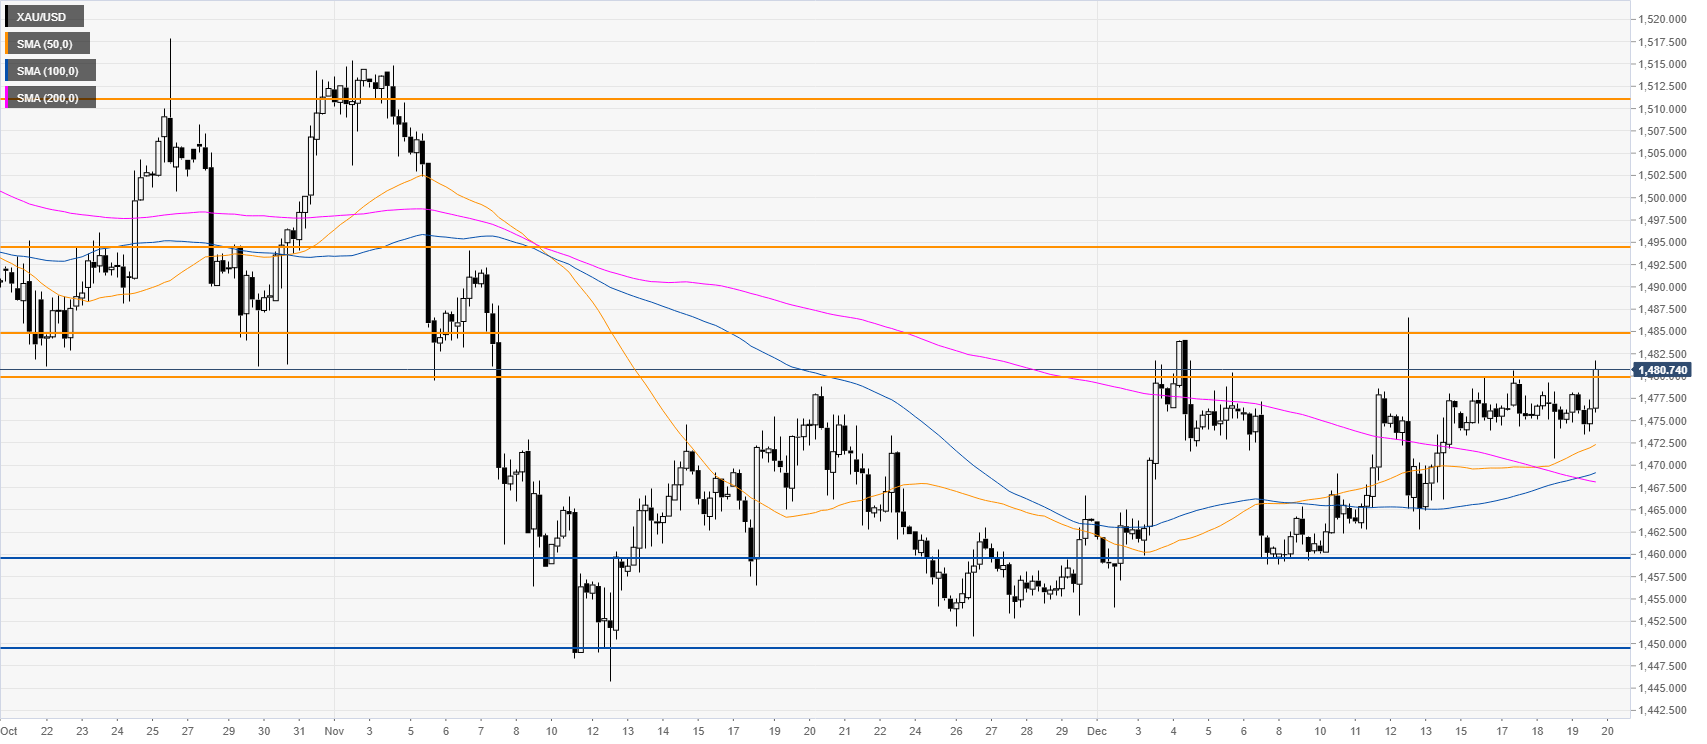
XAU/USD is penetrating in the 1480/85 resistance zone while above the main SMAs on the four-hour chart. However, the buyers are probably waiting for a catalyst to break above the 1480/85 resistance zone. If the breakout has follow-through, the next resistances could be near 1494 and 1510 levels. Conversely, if the sellers take over and fade 1480/85 price zone, XAU/USD could tumble towards the 1460/50 support zone.

Additional key levels
