USD/ZAR Price Analysis: Marks another pullback from 50-day EMA
- USD/ZAR fails to refresh the monthly high amid recoveries from 16.34.
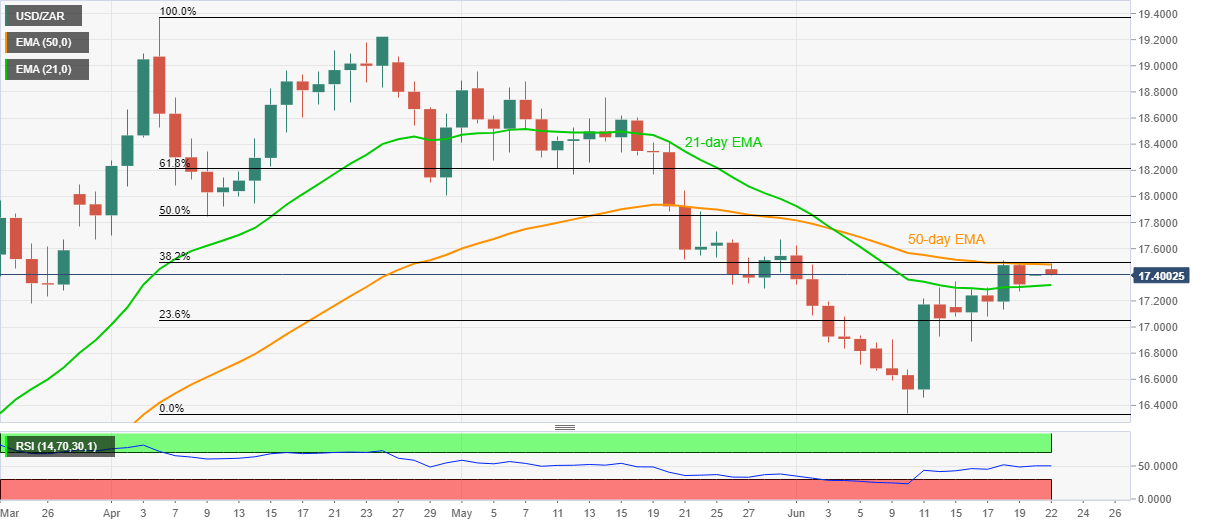
- 50-day EMA, 38.2% Fibonacci retracement guard immediate upside.
- 21-day EMA restricts pullback moves ahead of the 17.00 threshold.
USD/ZAR drops to 17.40, still up 0.40% on a day, during the Asian session on Monday. The pair’s week-start gap-up to 17.44 could be cited as the reason for the intraday gains despite the latest weakness. On the contrary, the pair’s downside is likely repeating its pullbacks from 50-day EMA and 38.2% Fibonacci retracement level of April-June fall. Even so, the pair stays above 21-day EMA, which in turn keeps the bulls hopeful.
As a result, the pair traders await a notable move either above 17.50 resistance confluence or below 21-day EMA level of 17.33 for fresh entries. Though, RSI conditions favor the continuation of the present recovery moves.
Should the pair manage to provide a daily closing beyond 17.50, May 29 top surrounding 17.67 could become their immediate favorite ahead of 50% Fibonacci retracement level of 17.85 and 18.00 round-figures. However, April 30 low near 18.00 could question the buyers afterward.
On the downside, a 17.00 might lure the bears in a case where the quote closes below 17.33. Additionally, the last week’s low near 16.89 might offer an intermediate rest if the USD/ZAR prices remain weak below 17.00, ahead of refreshing the monthly low of 16.33.
USD/ZAR daily chart
Trend: Pullback expected