Gold Price Analysis: Bears looking to test bull's commitments at $1,698
- Gold prices testing the commitments of the bulls in a failed attempt of $1,740/60 retracement.
- Bears hungry for a break below $1,700, but the path of least resistance could well be back to $1,750/60.
Technically, the gold price is no longer showing signs of an immediate advance back to test $1,760.
Instead, gold failed to extend beyond $1,740 and printed a fresh low to $1,702 as the US dollar and yields came up for air.
However, if there is no break of $1,702, which would otherwise open prospects of $1,685 as a measured Fibonacci retracement target of the range between $1,760 and Wednesday’s low of $1,702, the longer-term time frames should be noted.
The price still requires a fuller retracement.
The following top-down analysis illustrates the prospects for a full retracement.
Weekly chart
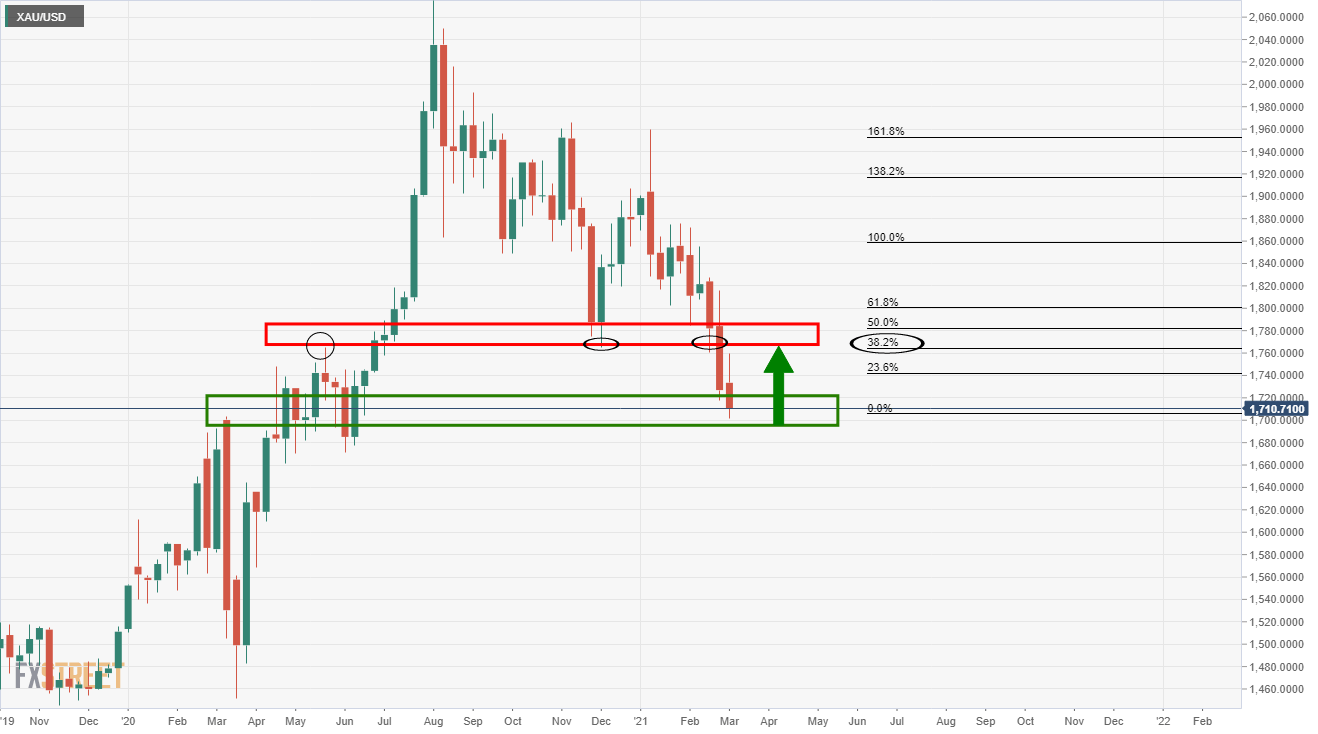
Daily chart
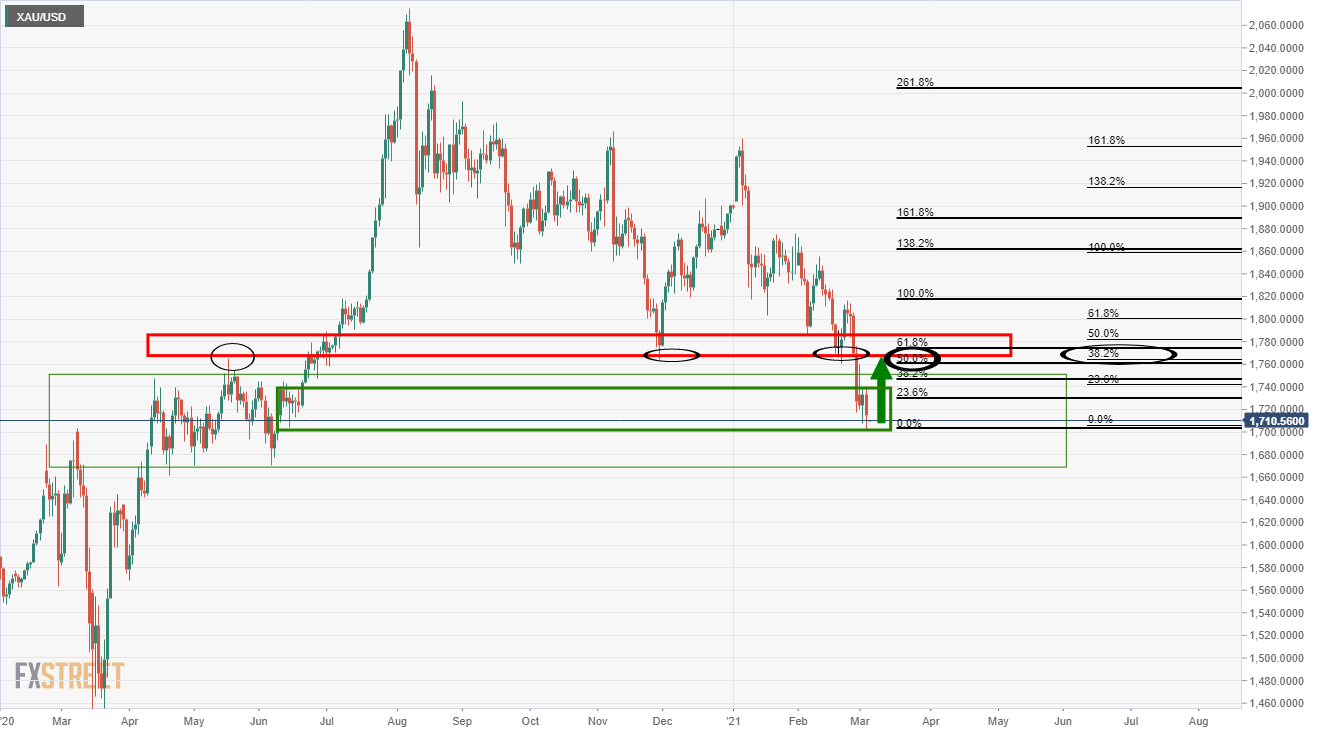
The daily chart offers prospects of the price stabilising here and correction in a 50% mean reversion for the confluence of the weekly 38.2% Fibo and prior lows illustrated on both the weekly and daily charts.
4-hour chart
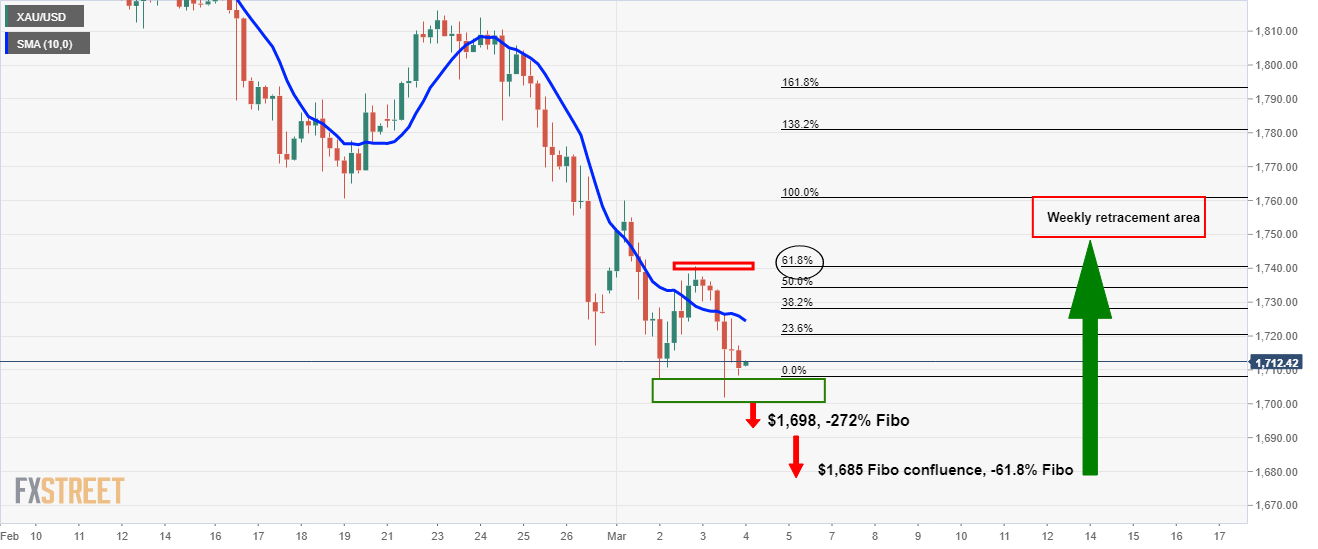
Currently, from a 4-hour perspective, the price is resisted by the 10 SMA in a decline from the 61.8% Fibonacci of the latest 4-hour correction of the prior bearish impulse.
However, there are signs of consolidation while closing above prior 4-hour support lows.
Having said that, as explained in the introduction, a break of 1,700 opens risk to $1,685 as a measured Fibonacci retracement target of the range between $1,760 and Wednesday’s low of $1,702. It is also the -61.8% Fibo retracement of the 4-hour correction's range.
$1,698 comes as the -272% Fibo of the same range which may offer strong support.