Silver Price Analysis: XAG/USD’s upside remains capped by 50-DMA amid mixed signals
- Silver lacks a clear directional bias, as the three-day winning streak stalls.
- RSI holds above the midline but bear cross on the 1D chart warrants caution.
- A drop towards $25.25 key support cannot be ruled out.
Having failed to find acceptance above the 50-daily moving average (DMA) at $26.06, silver (XAG/USD) sellers have fought back control on Monday.
The white metal snaps a three-day winning streak and remains trapped in a narrow range between the 50-DMA and 100-DMA barrier amid mixed technical signals. The 100-DMA support is aligned at $25.82.
On one hand, the 14-day Relative Strength Index (RSI) keeps its range above the midline, currently at 54.94, suggesting that the upside bias remains intact.
Meanwhile, a bear cross spotted on the said time frame last week points to a potential downside. The bearish crossover got confirmed after the 21-DMA pierced through the 200-DMA from above.
Silver Price Chart: Daily
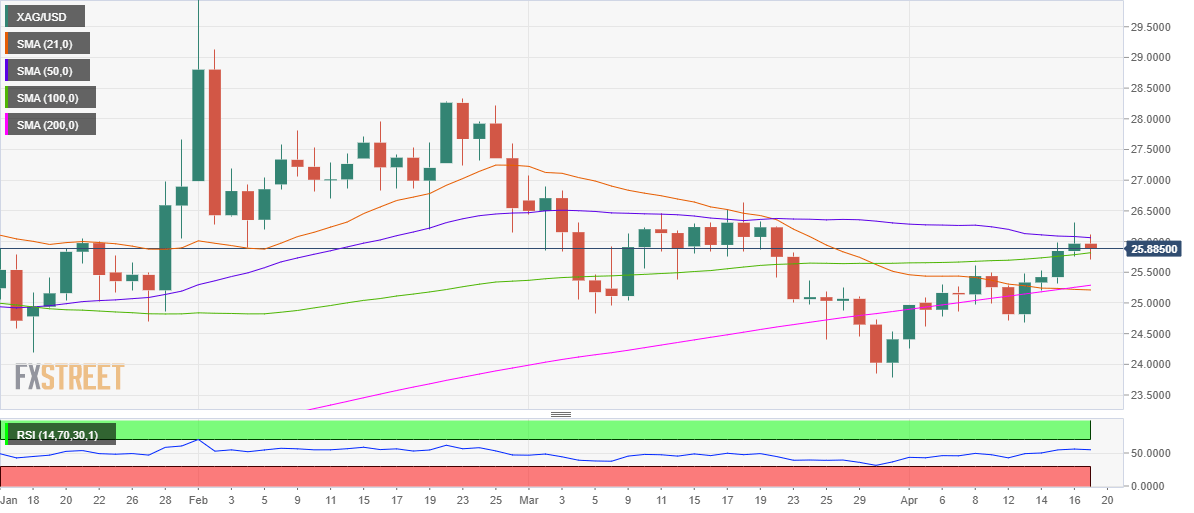
Therefore, if the selling pressure intensifies, the 100-DMA support could be put at risk once again, opening doors towards the confluence of the 21 and 200-DMAs around $25.25.
On the flip side, a daily closing is needed above the 50-DMA to negate the bearish pressures while prompting the XAG bulls to take on the March 18 high of $26.64.
Silver Additional levels