Gold Price Forecast: XAU/USD bears testing the bullish commitments, as Jackson Hole kicks off
- Gold price in downside consolidation below $1800 amid cautious markets.
- Gold traders look to the Jackson Hole Symposium and US data for fresh direction.
- Gold’s path of least resistance appears down on the four-hour chart.
Gold price fell for the second straight day on Wednesday, witnessing heavy losses following a breach of critical support near the $1791 region. However, the bulls manage to deliver a daily closing above the latter. The downside in gold price was mainly fuelled by the upbeat market mood, with yet another record rally on Wall Street indices and strengthening US Treasury yields. Higher yields dull the attractiveness of the non-yielding gold.
The risk-on theme was floated amid fading jitters over a potential Federal Reserve (Fed) tapering and the renewed US fiscal stimulus optimism. The US House of Representatives approved a $3.5 trillion budget framework and agreed to vote by September 27 on a $1 trillion Senate-passed infrastructure bill, which lifted the Wall Street indices to fresh record highs. However, the US dollar’s weakness, courtesy of the risk-on flows and mixed US Durable Goods data, offered some respite to gold bulls at the close. Gold price rose as highs as $1803 on Wednesday before slumping to $1783. The price eventually finished the day at $1791, falling 0.7% while recording its biggest one-day decline in more than two weeks.
Attention now turns towards the much-awaited three-day Fed’s Jackson Hole Symposium, kicking off Thursday. The speeches by the Fed policymakers, especially the one from Chair Jerome Powell will set the tone for the market in the coming weeks. Amidst growing Delta covid variant concerns, the Fed is widely expected to tone down its hawkish stance, pouring cold water on the expectations of a taper timeline. Investors are expected to remain on the sidelines heading into the event while the US GDP and weekly Jobless Claims could also offer some trading impetus. However, the gold price action will likely remain subdued ahead of Powell’s speech due at 1400 GMT on Friday.
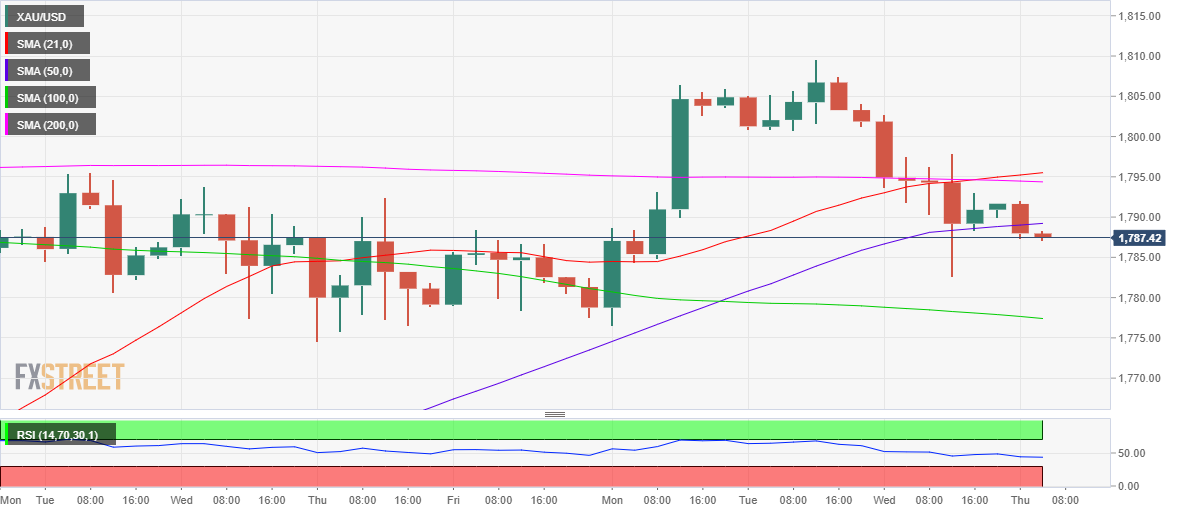
At the time of writing, gold price is holding the lower ground around $1787, as the US dollar duplicates Wednesday’s Asian price moves, attempting a tepid bounce across the board.
Gold Price Chart - Technical outlook
Gold: Four chart
Gold price defied the bullish odds on Wednesday, extending the drop following a rejection at the critical 200-Daily Moving Averages (DMA), then at $1810.
Now looking from a near-term technical perspective, gold price has breached the 50-Simple Moving Average (SMA) at $1789, unleashing the additional downside towards the mildly bearish 100-SMA at $1777.
Ahead of that support, Wednesday’s low of $1783 could be retested. Should the 100-SMA cushion give way, then a drop towards the $1750 psychological level would be inevitable.
The Relative Strength Index (RSI) trades listlessly below the midline, keeping floors open for further declines.
On the flip side, acceptance above the 50-SMA could recall the buyers, aiming for powerful resistance around $1795. That level is the confluence of the 200 and 21-SMAs.
Further up, the $1800 threshold will challenge the bullish commitment on its way to the August 24 highs of $1810.