Silver Price Forecast: XAG/USD struggles at $22.50 on rising US T-bond yields
- The market sentiment is upbeat, which triggers a move from safe-haven assets towards riskier ones.
- Rising US T-bond yields boost the greenback while weakens the non-yielding silver.
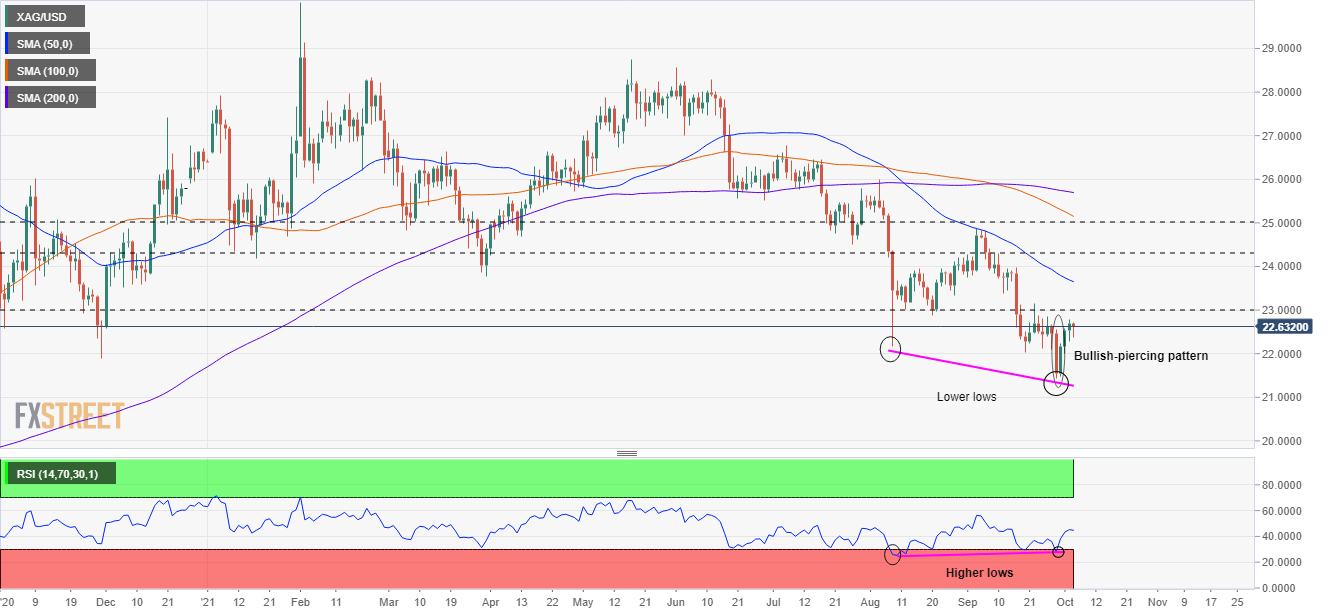
- Positive divergence and a bullish-piercing pattern on a daily chart triggered the move towards $22.60.
Silver (XAG/USD) is sliding for the first day out of four, trading at $22.62, down 0.25% during the day at the time of writing. Investors’ risk appetite is in risk-on mode, depicted by US stock indices price action, with the S&P500, the Dow Jones, and the Nasdaq posting gains of 1.48%, 1.29%, and 1.90%, respectively.
Higher US T-bond yields, weighing on silver
The US 10-year Treasury yield is rising four basis points (bps), sitting at 1.522%, weighing on the white metal price, as higher bond yields mean higher real yields, hurting the prospects of non-yielding assets, like gold and silver. In the meantime, the US Dollar Index (DXY), which tracks the buck’s performance against its peers, is up 0.13%, currently at 93.93.
XAG/USD Price Forecast: Technical outlook
In a daily chart, XAG/USD is trading below the daily moving averages (DMA’s), suggesting that silver is in a downtrend. However, the bounce off at $21.00 on a positive divergence between price action and momentum indicator like the Relative Strength Index (RSI) spurred an upside move capped around $22.60, which was previously tested unsuccessfully six times. Additionally, the presence of a bullish-piercing candle pattern exerted further upward pressure on the move.
A daily close above $22.60 could open the door for further gains. The first resistance would be $23.00. A break above the latter would expose key support supply levels. The 50-day moving average (DMA) at $23.69, followed by the September 10 high at $24.29.
On the other hand, failure at $22.60 could pave the way to a fall towards the 2021 year lows around $21.00, but it will find some hurdles on the way down. The first demand zone would be $22.00. A breach beneath that level would expose essential demand areas at $21.42, followed by $21.00.
The Relative Strength Index (RSI) is at 44, slightly down, suggesting downward pressure still on the white metal and could trigger another leg down.